Before a purchase can be made or a conversion occurs, prospective customers first need to interact with your business to build an understanding of the products you offer and the services you provide. This process of getting to know a particular company is known as the ‘customer buying journey’ or ‘sales funnel.’
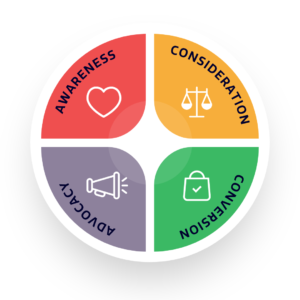
Although an experience can vary for each customer, their journey usually begins at the “awareness stage”. Here, content should be focused on helping users to identify and solve their problems. Content in the “consideration stage” highlights your products or services as a solution to their problems. This leads to the “conversion stage”, where content helps users make the final decision and complete a conversion goal. What follows is the “advocacy stage” – this is how you encourage users to promote your business through word-of-mouth (WOM) and continue to purchase your products.
For companies that want to improve their sales and generate new leads continually, marketers should consistently improve content. To do this, the performance of existing content needs to be measured. Businesses can use a variety of sales funnel KPIs (key performance indicators) to objectively measure their marketing campaigns’ success.
Before tracking metrics and assuming what they mean in regard to your marketing efforts, it is essential to know what results in success for your business. Successful companies define SMART goals to track their marketing strategies and optimise their efforts. Each objective should abide by the following characteristics:
“Specific” goals ensure that your team has a clear idea of the journey it will take to get from point A to B. This makes it easier to prioritise the steps that need to be taken to achieve your goal.
“Measurable” goals allow you to keep track of the progress of your actions. A synchronisation between goal setting and KPI setting must ensure that the relevant metrics are being tracked for a particular goal. When measuring the success of your sales funnel, this point becomes evident. This article will help you to choose essential metrics at each stage of the customer journey, where you should set individual goals based on your desired outcome.
Goals should always be “attainable.” Businesses can waste time, resources and money by focusing on unrealistic goals. The team will feel unmotivated by unreachable goals. Meanwhile, setting ambitious yet realistic goals can provide motivation.
Before settling on a goal for your campaign, ensure that is “relevant” to the project. Although some goals seem important or exciting, ensure your priorities are invested in the current end goal.
To assert a sense of organisation, goals should be “time-specific.” Setting deadlines and creating urgency are key to encouraging focus and motivation.
Metrics or KPIs are an essential part of any business plan. They highlight where customers engage with your content and where you may need to refine your marketing strategy.
Businesses can track several different metrics across each stage of the customer journey. These will highlight where certain types of content are more successful in achieving their specific goals. In this article, we’ll break down some key metrics that you should pay attention to throughout each stage of the sales funnel.
The first stage of the customer journey introduces potential buyers to your company, brand story, products, and services. The goal is to help visitors identify their problems and offer a solution through industry expertise or your products and services.
Businesses can identify progress within the awareness phase by building brand awareness and providing positive experiences for prospects.
An impression is counted each time a prospect observes your piece of content. Multiple impressions can occur from one user. This can happen when the post is shared amongst their network several times.
Reach offers a slightly different insight into user awareness. This metric indicates the number of unique users presented with your content in their feed. Whether they see the content several times, this visitor only counts as one reach count.
Companies can track the success of a piece of content by measuring the audience growth rate after a certain amount of time. It measures your new followers as a percentage of your total audience.
To calculate the percentage by which your follower count has increased, simply divide the number of new followers by your total audience and multiply by 100.
The share of voice is a metric which has applications for social media, SEO and PPC campaigns during the awareness stage of the customer journey. Higher SoV enables increased brand awareness and effective lead generation among each channel.
Within social media, brands can attain a high share of voice by creating shareable content. Once interested users share your content, brand awareness can spread exponentially across their unique network.
When used for SEO purposes, your share of voice can be increased by improving rankings for keywords relevant to your product or service. By outperforming competitors, you can maintain a higher SoV.
Social media sentiment analysis provides information regarding how users express their feelings towards your brand. Likes and shares can obscure the true sentiment of the customer.
An analysis of posts and comments that have been shared about your business can be completed to determine whether the brand’s social sentiment is positive or negative. Various social media analysis tools will complete this process for you and provide a digestible review of consumer insights.
Brandwatch is one example. This tool will track mentions of your brand, products and logos across online platforms, and it will measure the impact of your strategies in real-time and alter them according to evolving customer perceptions.
Effective advertising involves providing memorable content that resonates with your target audience. This particular metric is used by Facebook to estimate the number of people who would recall an ad after it was presented on their social media feed.
You can also calculate the estimated ad recall lift rate by dividing the estimated ad recall lift by the reach of your ad. This would provide an estimated percentage of users who recall the ad compared to the total number of viewers.
Once a marketing qualified lead has discovered a solution to their problem, it is the responsibility of the business to engage that customer and entice them towards their particular product or service.
It is sensible not to push a hard sell at this stage as this may turn leads away while they are considering their options. Instead, your content should provide a presence that encourages them to narrow their purchasing options.
Social media and blog posts can perform differently depending on their content and narrative. The number of interactions with a particular post is a clear way of measuring customer engagement.
You can analyse customer engagement with your brand by measuring customer interactions across several platforms. Your qualified leads will interact with content differently depending on the platform they are using. On Facebook and LinkedIn, your content will receive likes and shares, whereas users can save Instagram posts, and on Twitter, you may want to analyse mentions and retweets. Specific metrics can provide more insight than others depending on your SMART goals.
Total engagement metrics, as mentioned above, analyse the complete account of interactions with one post or page over a specific time frame. Alternatively, the average engagement rate per post inspects your posts’ interaction relative to your audience’s size.
A good engagement rate is often established as 1% to 5%. However, this achievement becomes more challenging as your audience grows. Not every follower will engage with all of your posts. Keeping followers interested is a core part of the customer journey.
With each unique share, a new audience gains access to your content, building brand awareness and demonstrating rapport between your business and your existing audience.
The virality rate metric calculates how many times a post is shared. It can be computed by dividing the number of shares by the number of impressions. Multiplying this figure by 100 will provide your virality rate percentage.
Talkwalker is one example of a tool that social media marketers can use to track their virality rate. Their data analysis software provides an accessible virality calculator and visual display so you can easily track the success of your viral posts.
In our recent article on the utility of video marketing within the customer journey, we discussed how videos offer a passive way to engage with a business and learn more about the products that can solve a particular problem.
Video views can be valuable but aren’t as informative as completion rates. This metric will indicate how many users have played the video until the end. Successful engagement suggests that 70% of views reach completion.
The beginning of the consumer funnel is all about enticing and attracting potential customers whilst demonstrating that you have viable services to solve their needs. Meanwhile, the conversion stage is about grabbing a customer’s attention who is well acquainted with your business and convincing them to make a purchase decision or complete a lead conversion.
Customers are only likely to pay attention to and engage with an ad if it is relevant to the product being sold and the consumer’s needs. The click-through rate metric calculates the number of users who have found a particular ad engaging and valuable.
To reach a conclusion about the success of an ad campaign, the number of clicks can be divided by the total number of impressions. Multiplying this number by 100 will provide the click-through rate percentage.
The total cost of achieving a defined goal is termed cost per conversion. This figure indicates the amount of money spent on a particular campaign divided by the number of conversions.
Businesses that cannot achieve a low cost per conversion rate should evaluate the relevance of their advertisement concerning the selected keywords and products. If consumers are not engaging with the ad in the desired way, the copy may not be engaging to potential customers.
Cost per mile is a similar metric to CPC. Instead of analysing conversions, CPM determines the expenditure of achieving 1000 views on a landing page that have originated from an ad campaign. This metric can be used as a benchmark to measure the success of that particular campaign.
Conversions don’t always necessarily imply that a purchase has been made. Companies can determine a successful conversion to include anything from signing up for a newsletter, clicking a particular button, or starting a free trial.
To measure your conversion rate, the number of conversions needs to be divided by the total number of visitors to a particular page or website. If you are measuring the success of a paid ad campaign, the number of visitors that originated from the advertisement click-through can be measured.
Bounce rate is a metric that indicates the percentage of visitors who left your website from their entrance page. A higher bounce rate generally suggests that customers aren’t engaging with your website or the content is unclear.
Not only is this metric considered to be one of the most influential ranking factors, but it also provides businesses with the opportunity to improve their website or its content.
The advocacy stage is often the most challenging phase of the customer journey. However, once they arrive, your converted customers become brand ambassadors. They will share their stories, encourage engagement with your content and provide recommendations to their online and offline networks.
One way of measuring customer loyalty is the net promoter score. This measures your customer’s perceptions of your brand and their ability to encourage growth.
A score can be calculated based on how an individual engages with your brand online after converting. This data can be gathered through post-purchase surveys or social media posts.
You can determine your score by totalling the number of positive, negative, and neutral responses. To calculate your NPS, subtract the percentage of detractors from the percentage of promoters.
High promoter scores are achieved by customers who continue to purchase from you and refer others to encourage your growth. Alternatively, detractors are the customers who have had a poor experience with your company. They often post bad reviews and reduce your growth with negative word-of-mouth. Companies can avoid negative net promoter scores by addressing customer complaints with remedial measures such as free exchanges and discounts.
Customer satisfaction is quick and easy to measure once a customer has received their purchase. Ask clients to complete a brief survey asking how satisfied they were with the service they received. Businesses can obtain further detailed information by conducting qualitative research.
With this information, businesses can identify whether they can improve any stage of the customer journey and retain customer loyalty.
Creating unique and effective content for each stage of the customer journey is essential for nurturing potential leads and acquiring their loyalty. Businesses that continue to create content without addressing particular metrics will fail to develop their strategy and will be confused about their lack of improvement.
Meanwhile, businesses that invest time and money in measuring the key metrics during the sales funnel, will discover actionable insights to improve their strategy. This can lead to higher engagement rates, lower bounce rates, and long-term customer retention.
This Halloween, it’s time to face your marketing fears. Creating a frighteningly fresh approach to B2B marketing strategies takes blood, guts and insight into the digital marketing industry as a whole. Here at Pinnacle Internet Marketing, B2B marketing is our bread and butter. We offer SEO, social media and web development to businesses worldwide. We’re […]
What is Q4 Planning, and Why is it Important? ‘Q4’ Planning is the term businesses use to refer to the fourth quarter of the financial year. It starts on the 1st of October and ends on December 31st, before the start of the new financial year. For consumers, it may be a time to wind […]
What is Marketing Automation in Digital Marketing? What is Marketing Automation? Marketing automation is a technique that uses software to automate a range of marketing processes within one platform. The core purpose of marketing automation is to enhance efficiency and convenience throughout the marketing process, from lead generation to customer retention. This process enables businesses […]